View more text...
The following is taken from an article written by Laura Sydell for KQED
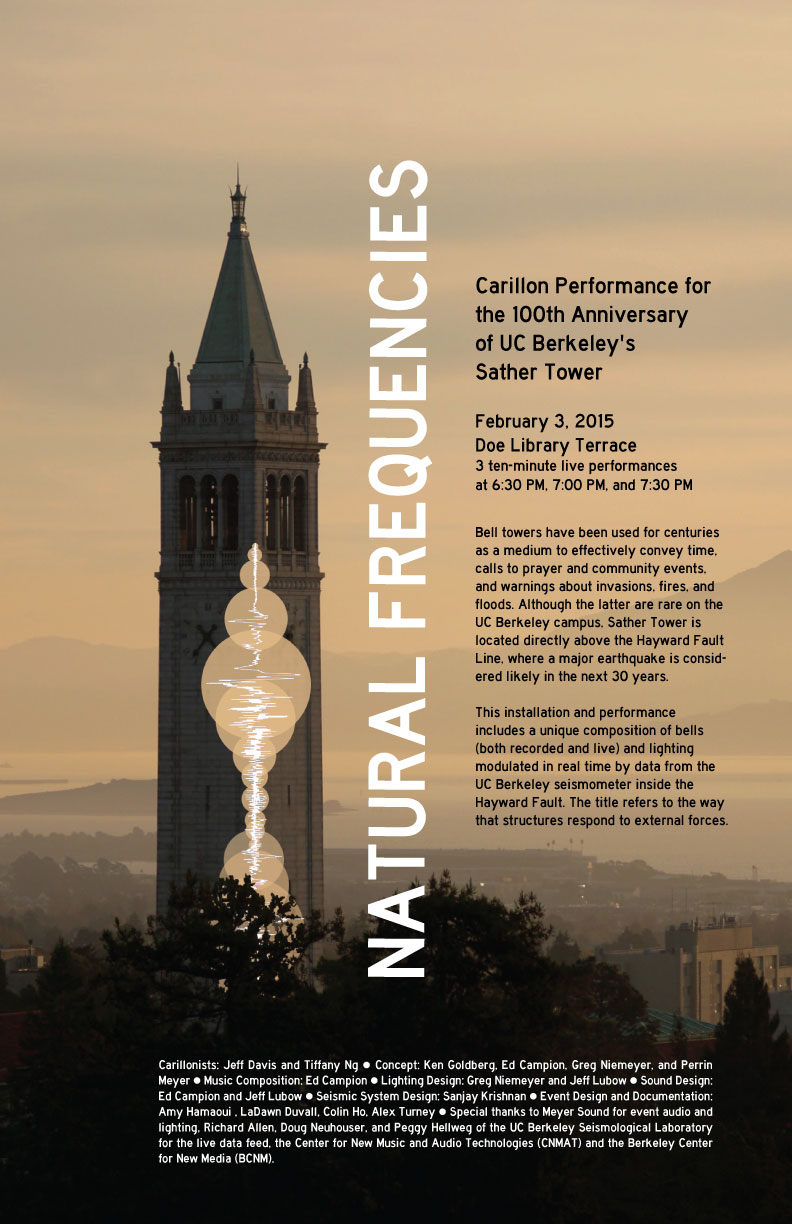
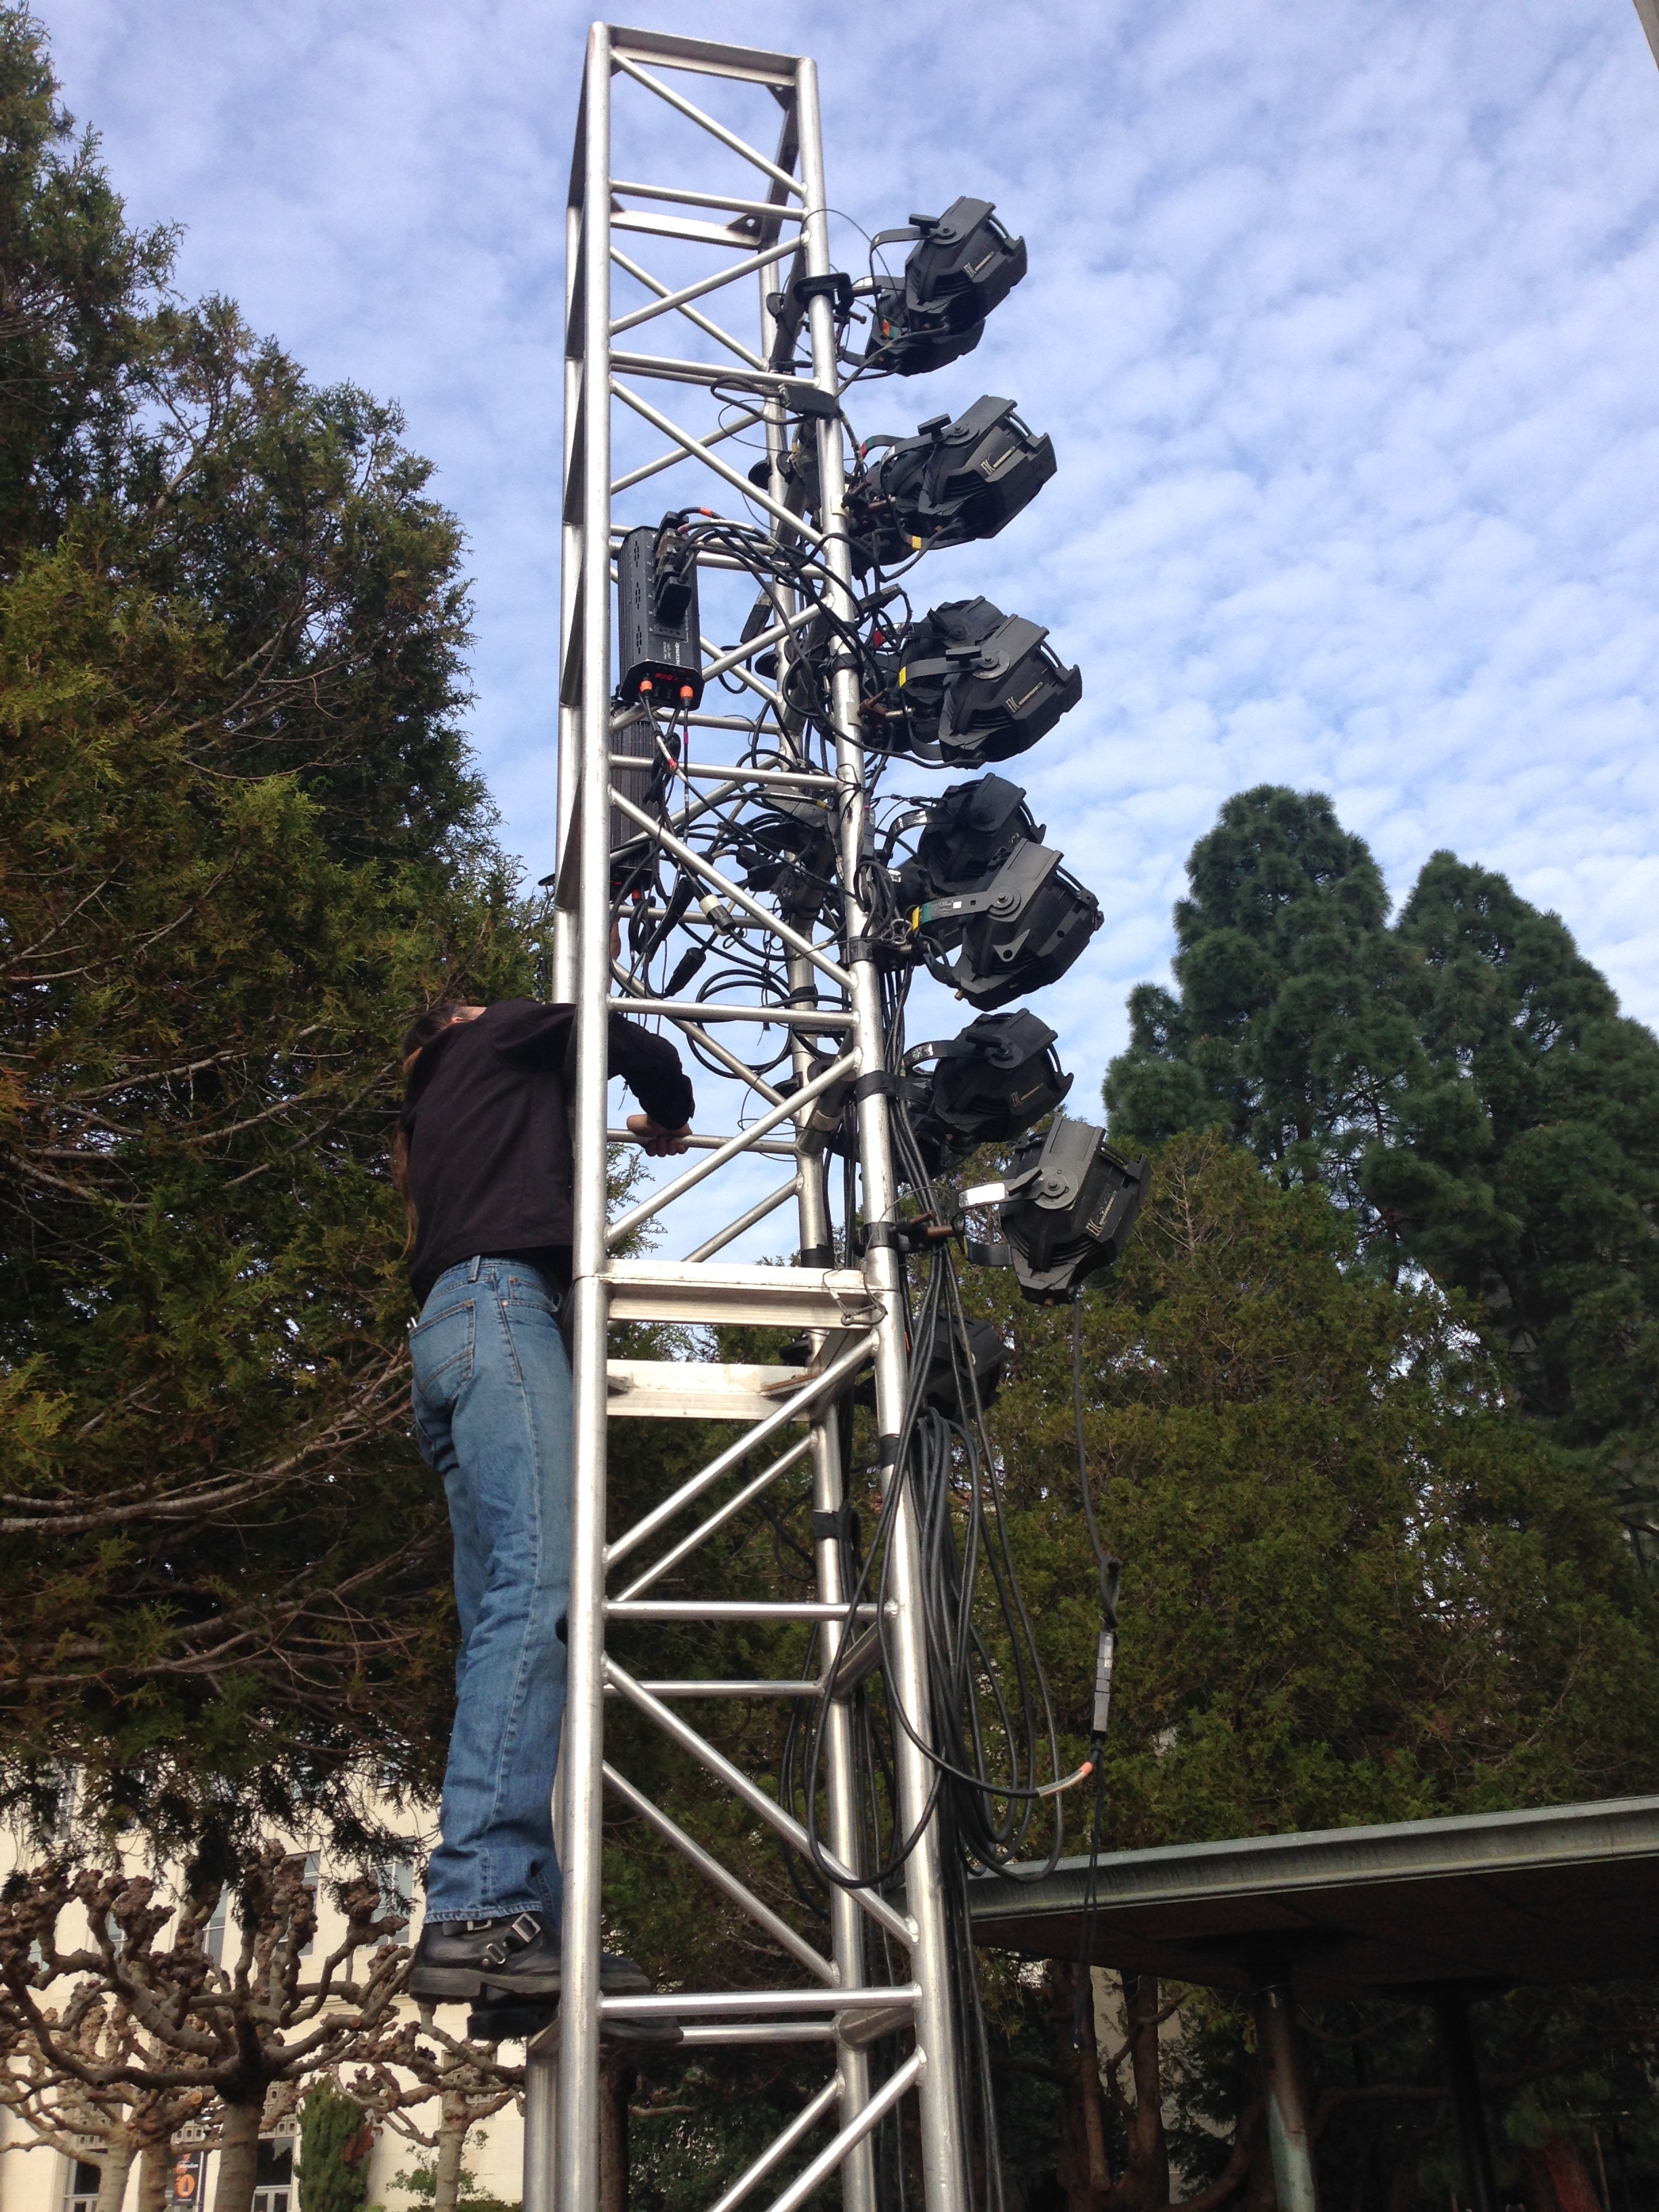
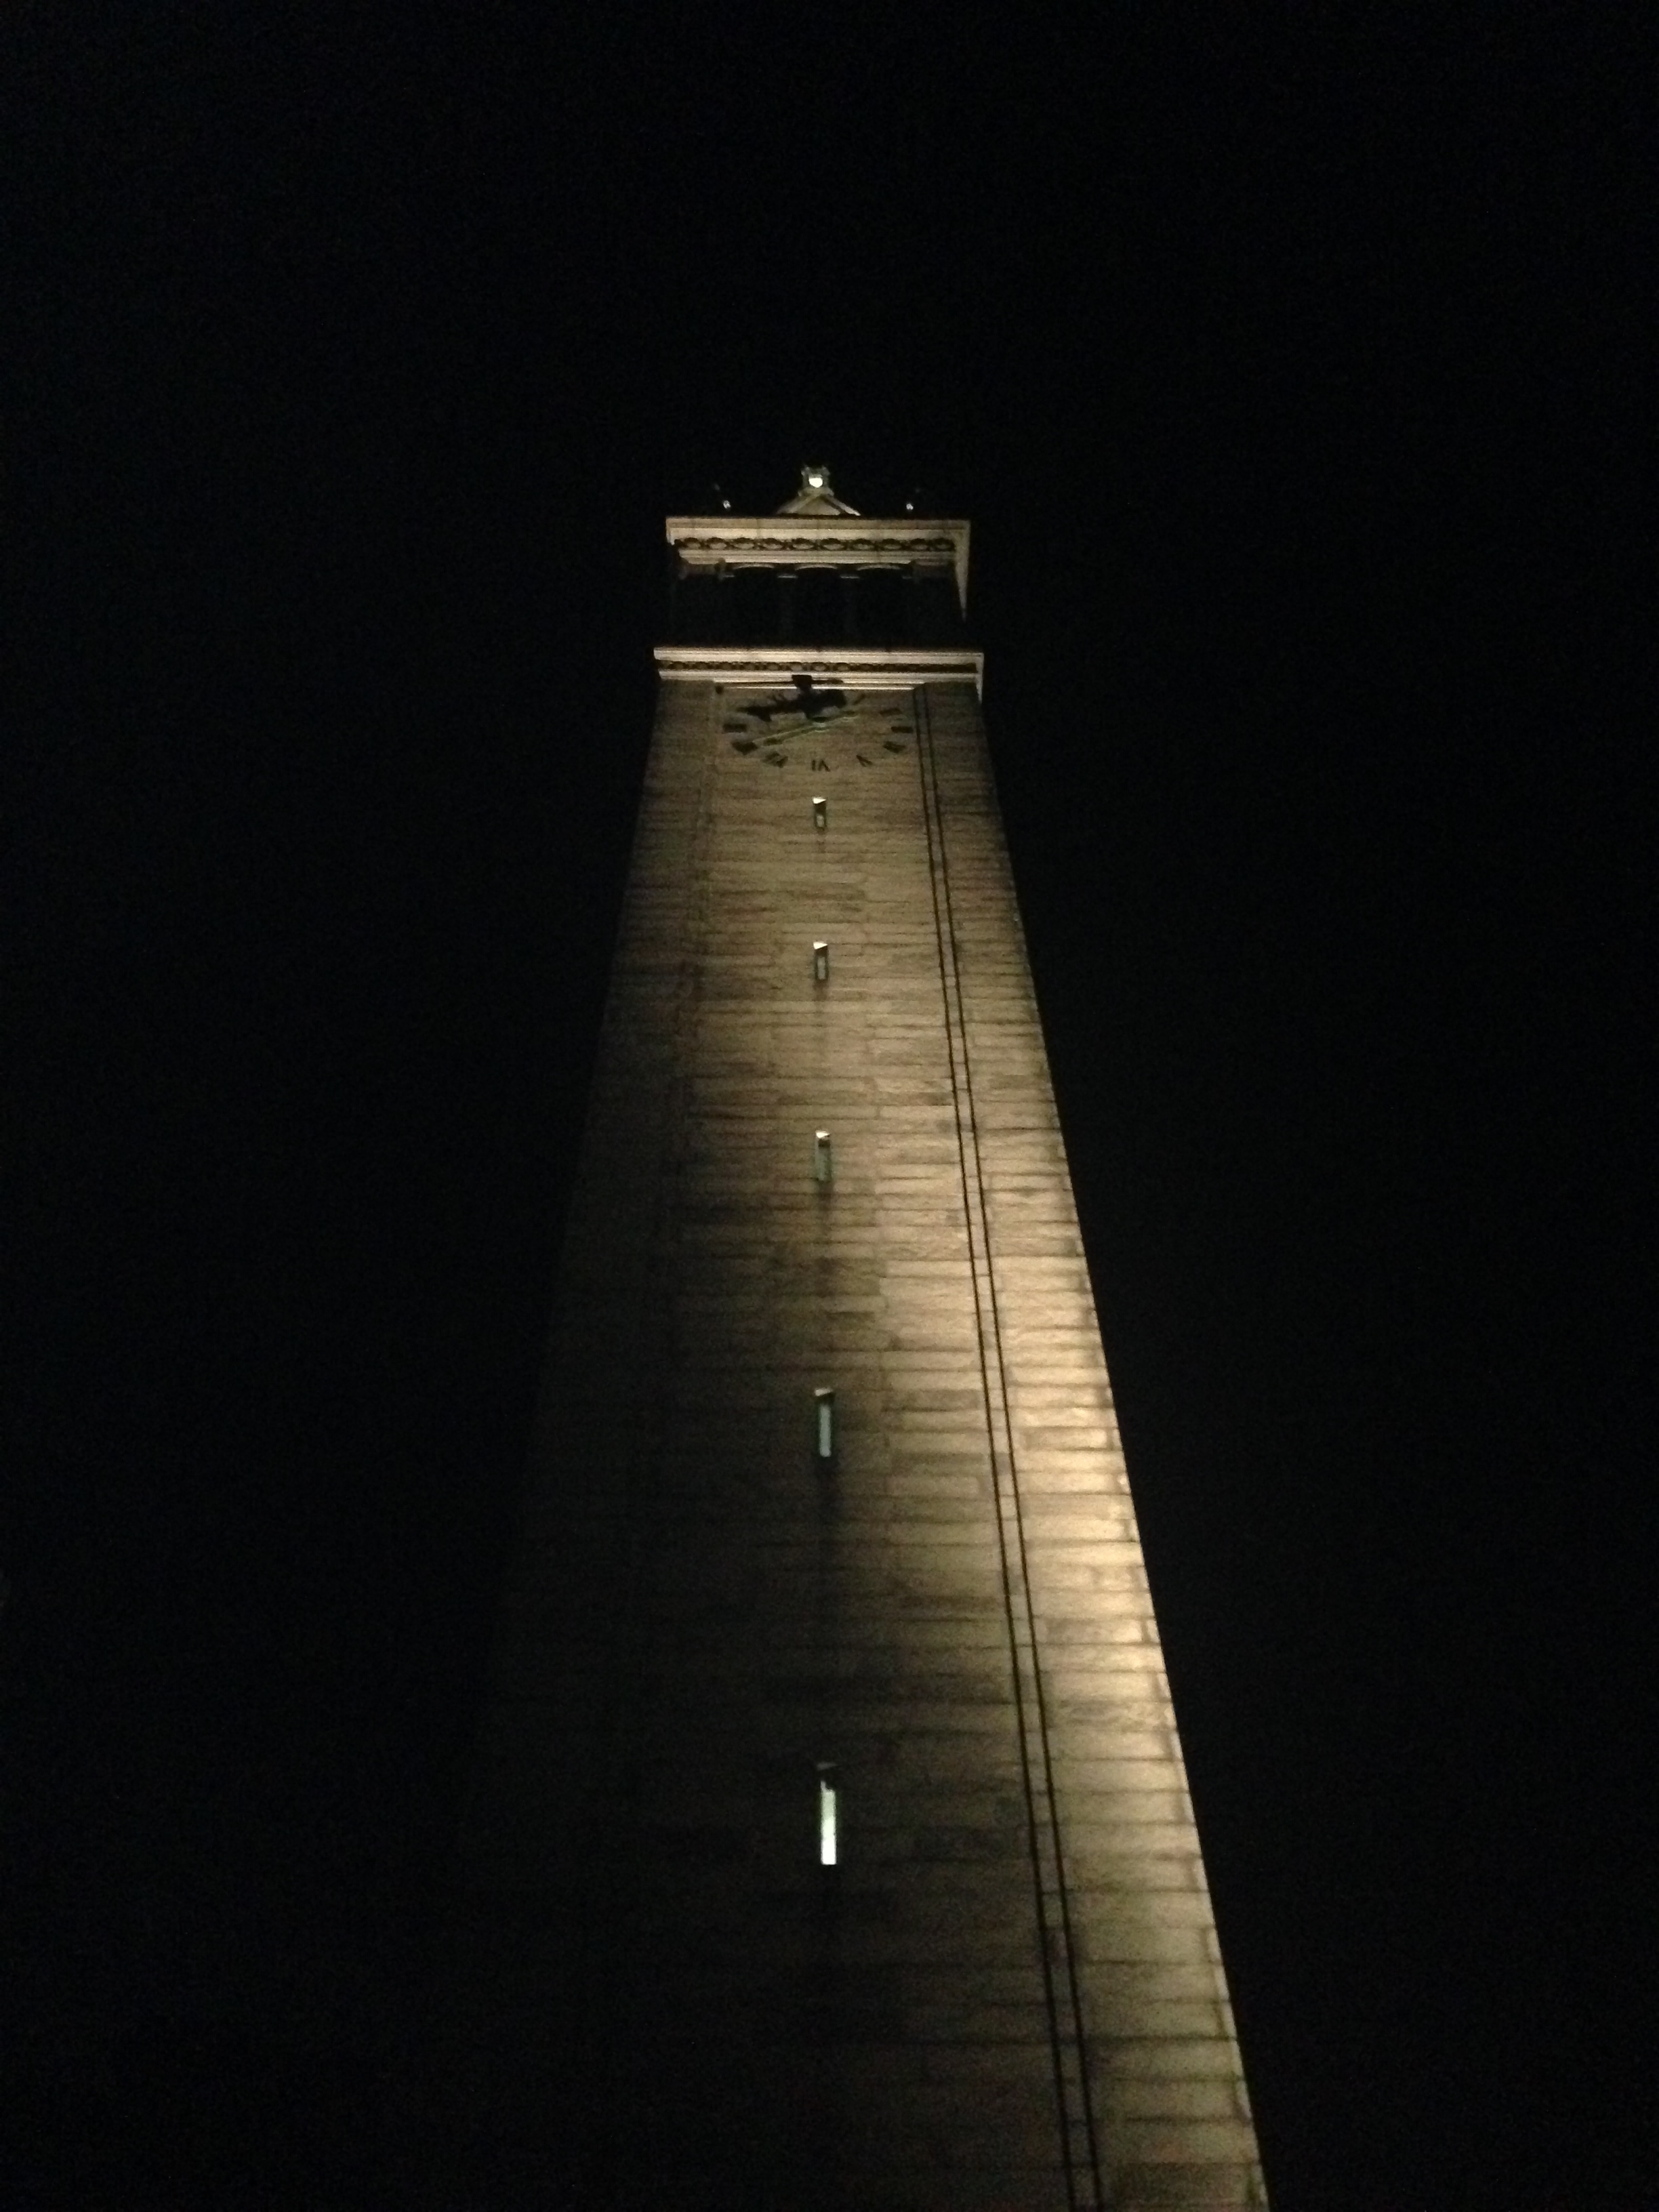
When the bells of Sather Tower on the UC Berkeley campus ring out on the evening of Tuesday, Feb. 3 [2015], the sound will amplify the low rumble of the earth that most of us in the Bay Area prefer to forget. In a project called “Natural Frequencies,” conceived by composer Edmund Campion, artist and roboticist Ken Goldberg and artist Greg Niemeyer—all UC Berkeley faculty—the bells are programmed to play a score composed in real time by the seismic shifts taking place along the Hayward Fault, directly below the Campanile. Accompanying the bells is a light show, also programmed to respond to the fault’s movements. Seismologists predict the Hayward Fault as the source of a major temblor within the next three decades. If an earthquake were to happen during Tuesday's performance, Campion says it would be more than apparent in the sound of the bells and fluctuation of the lights.
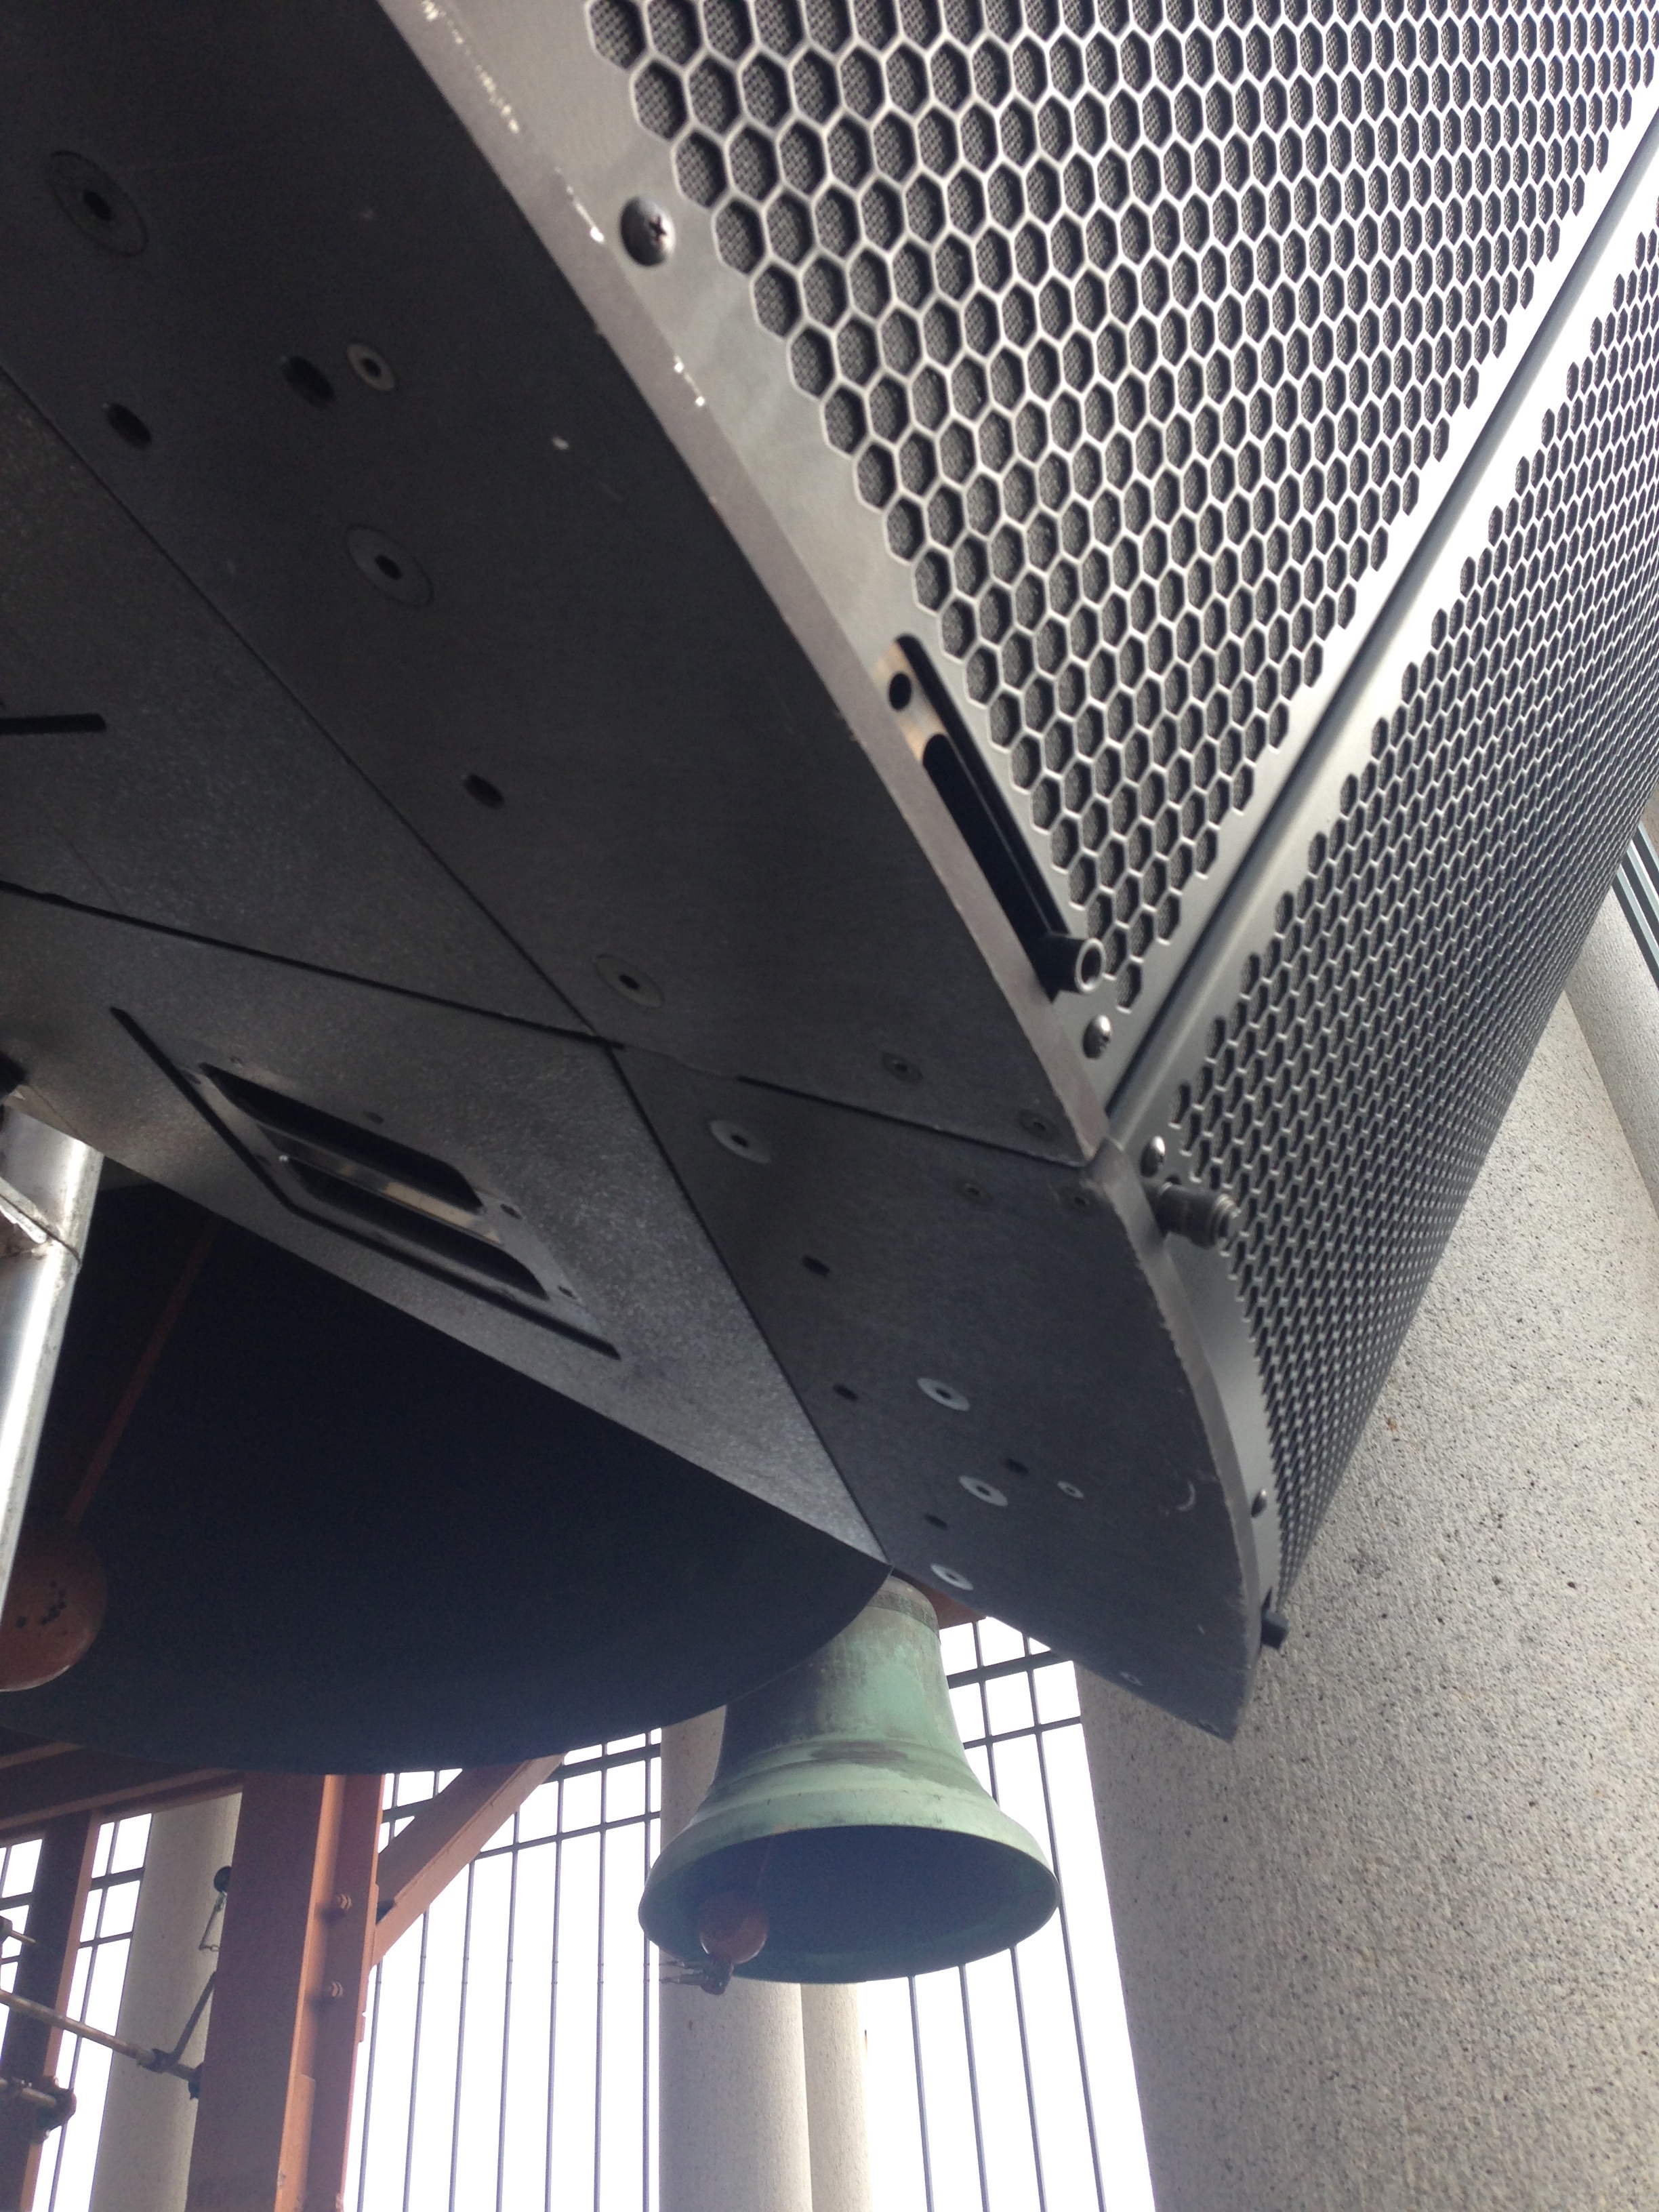
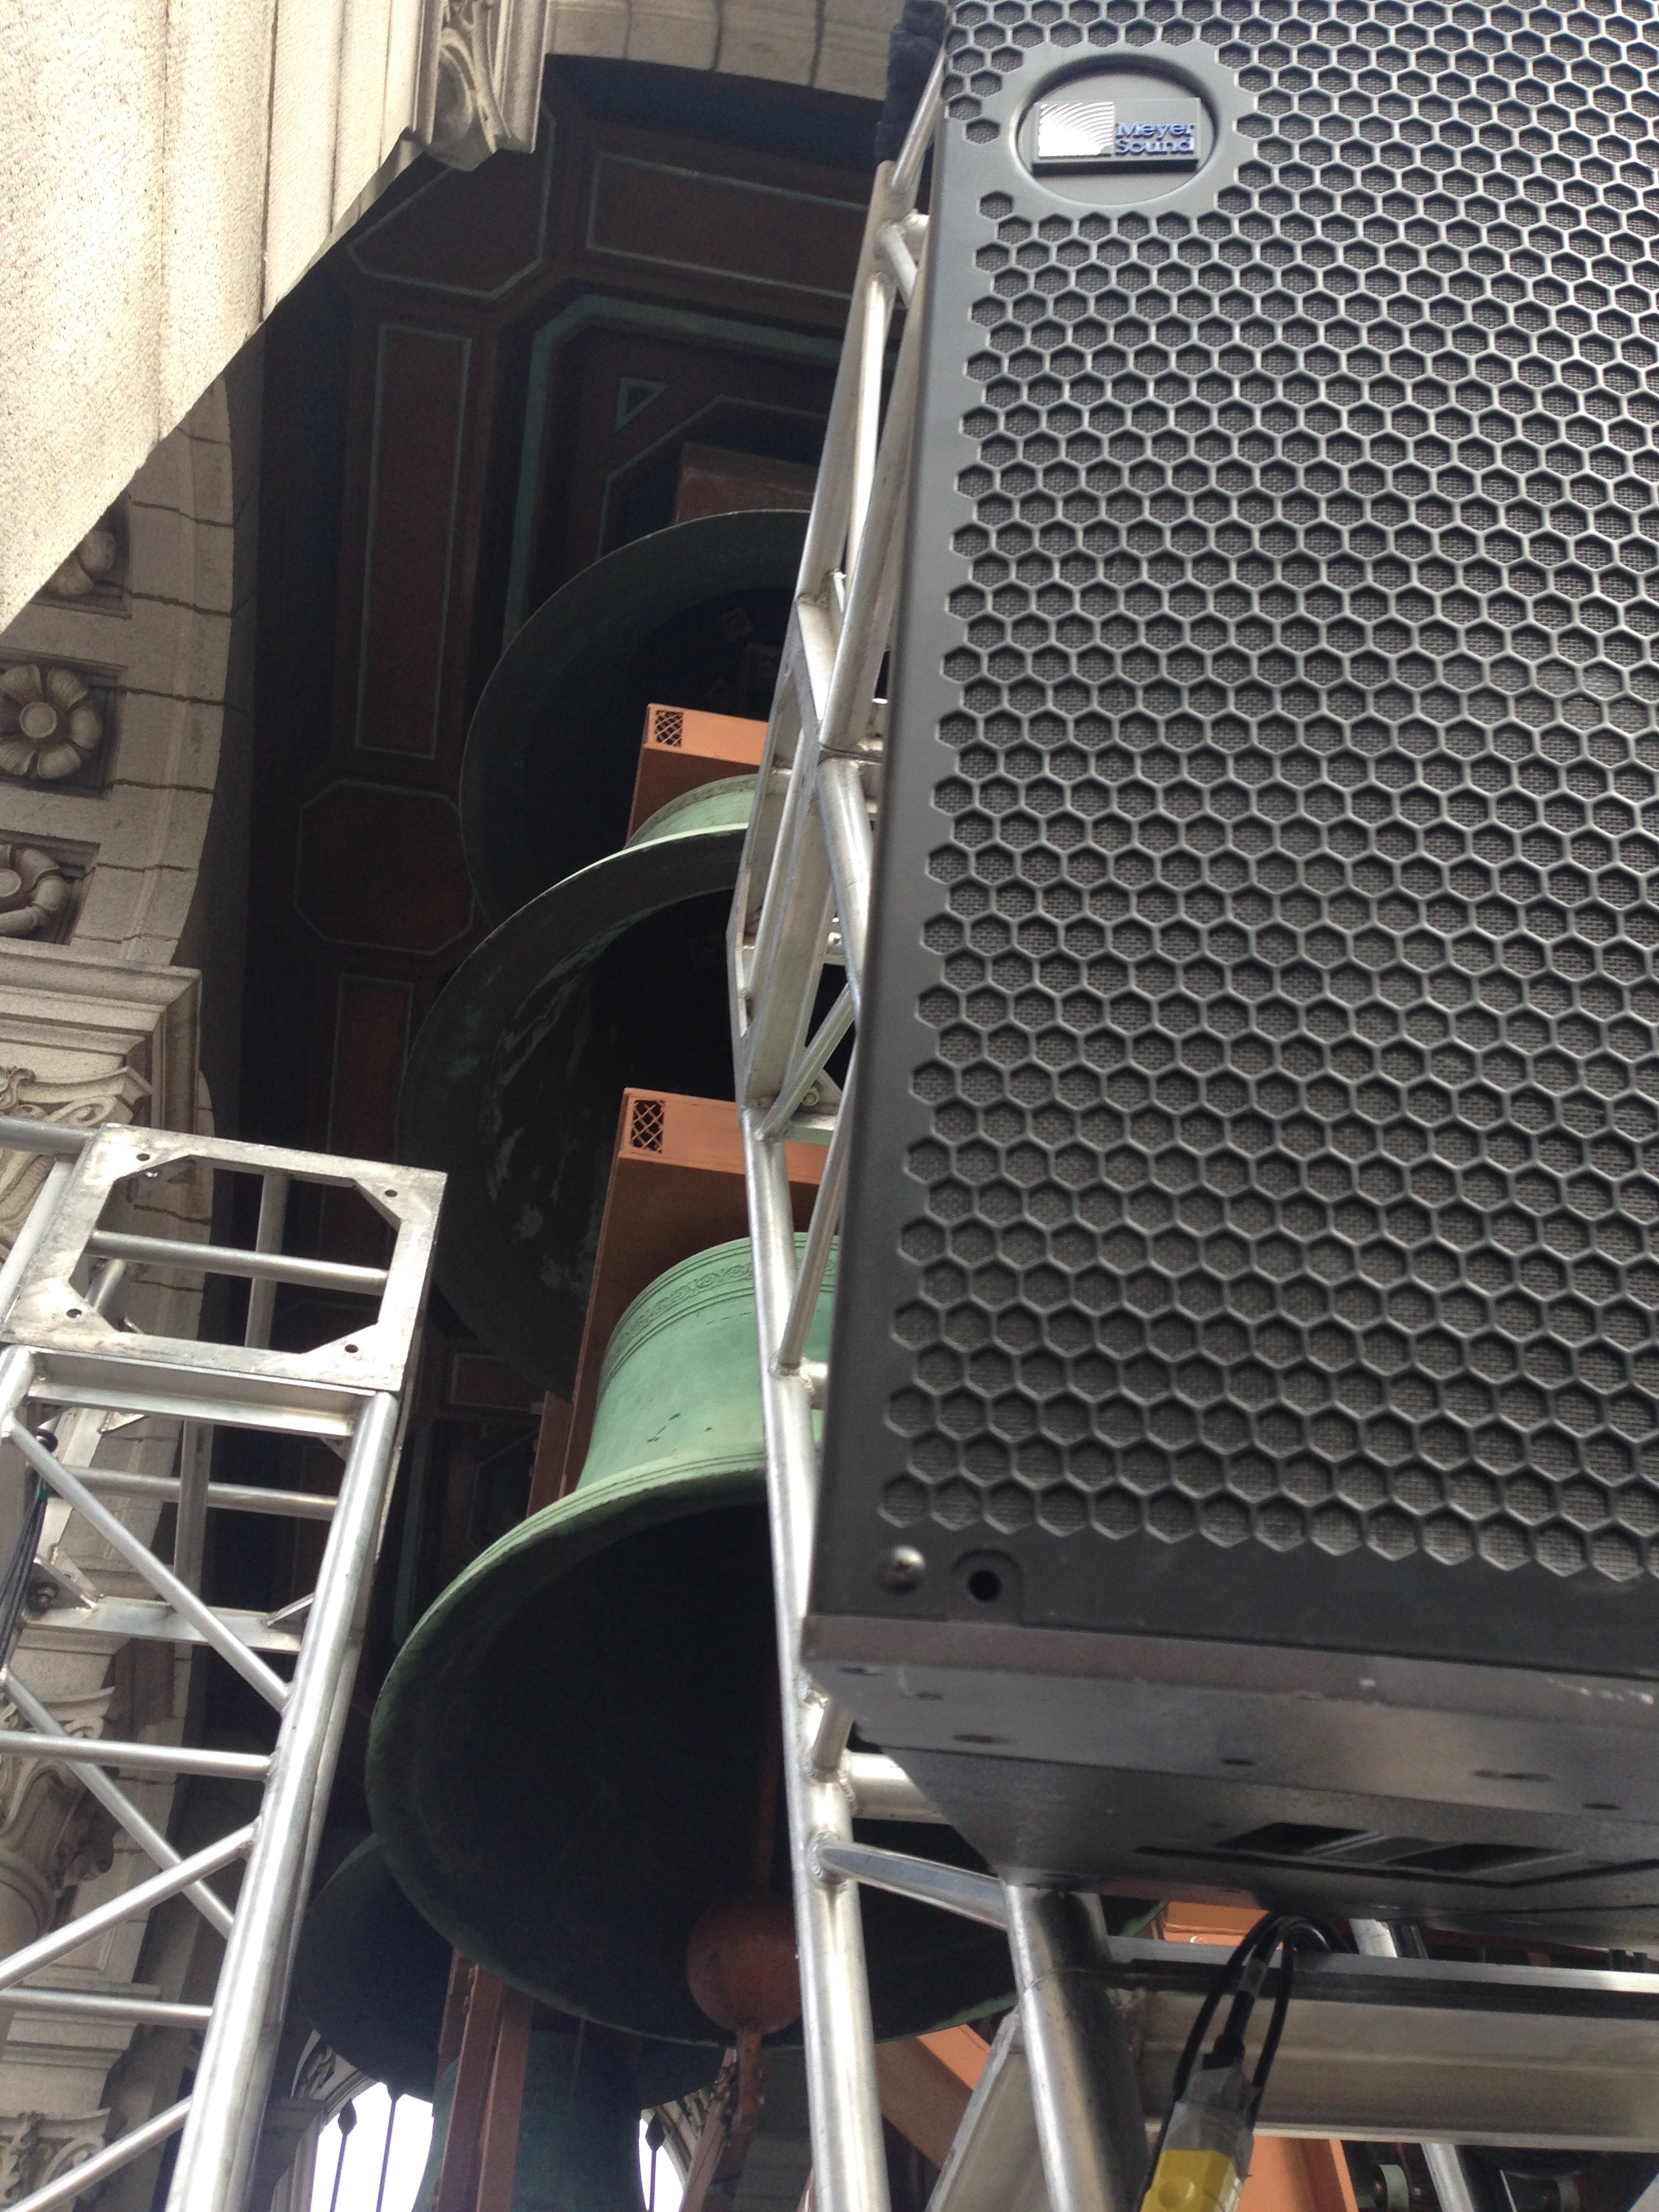
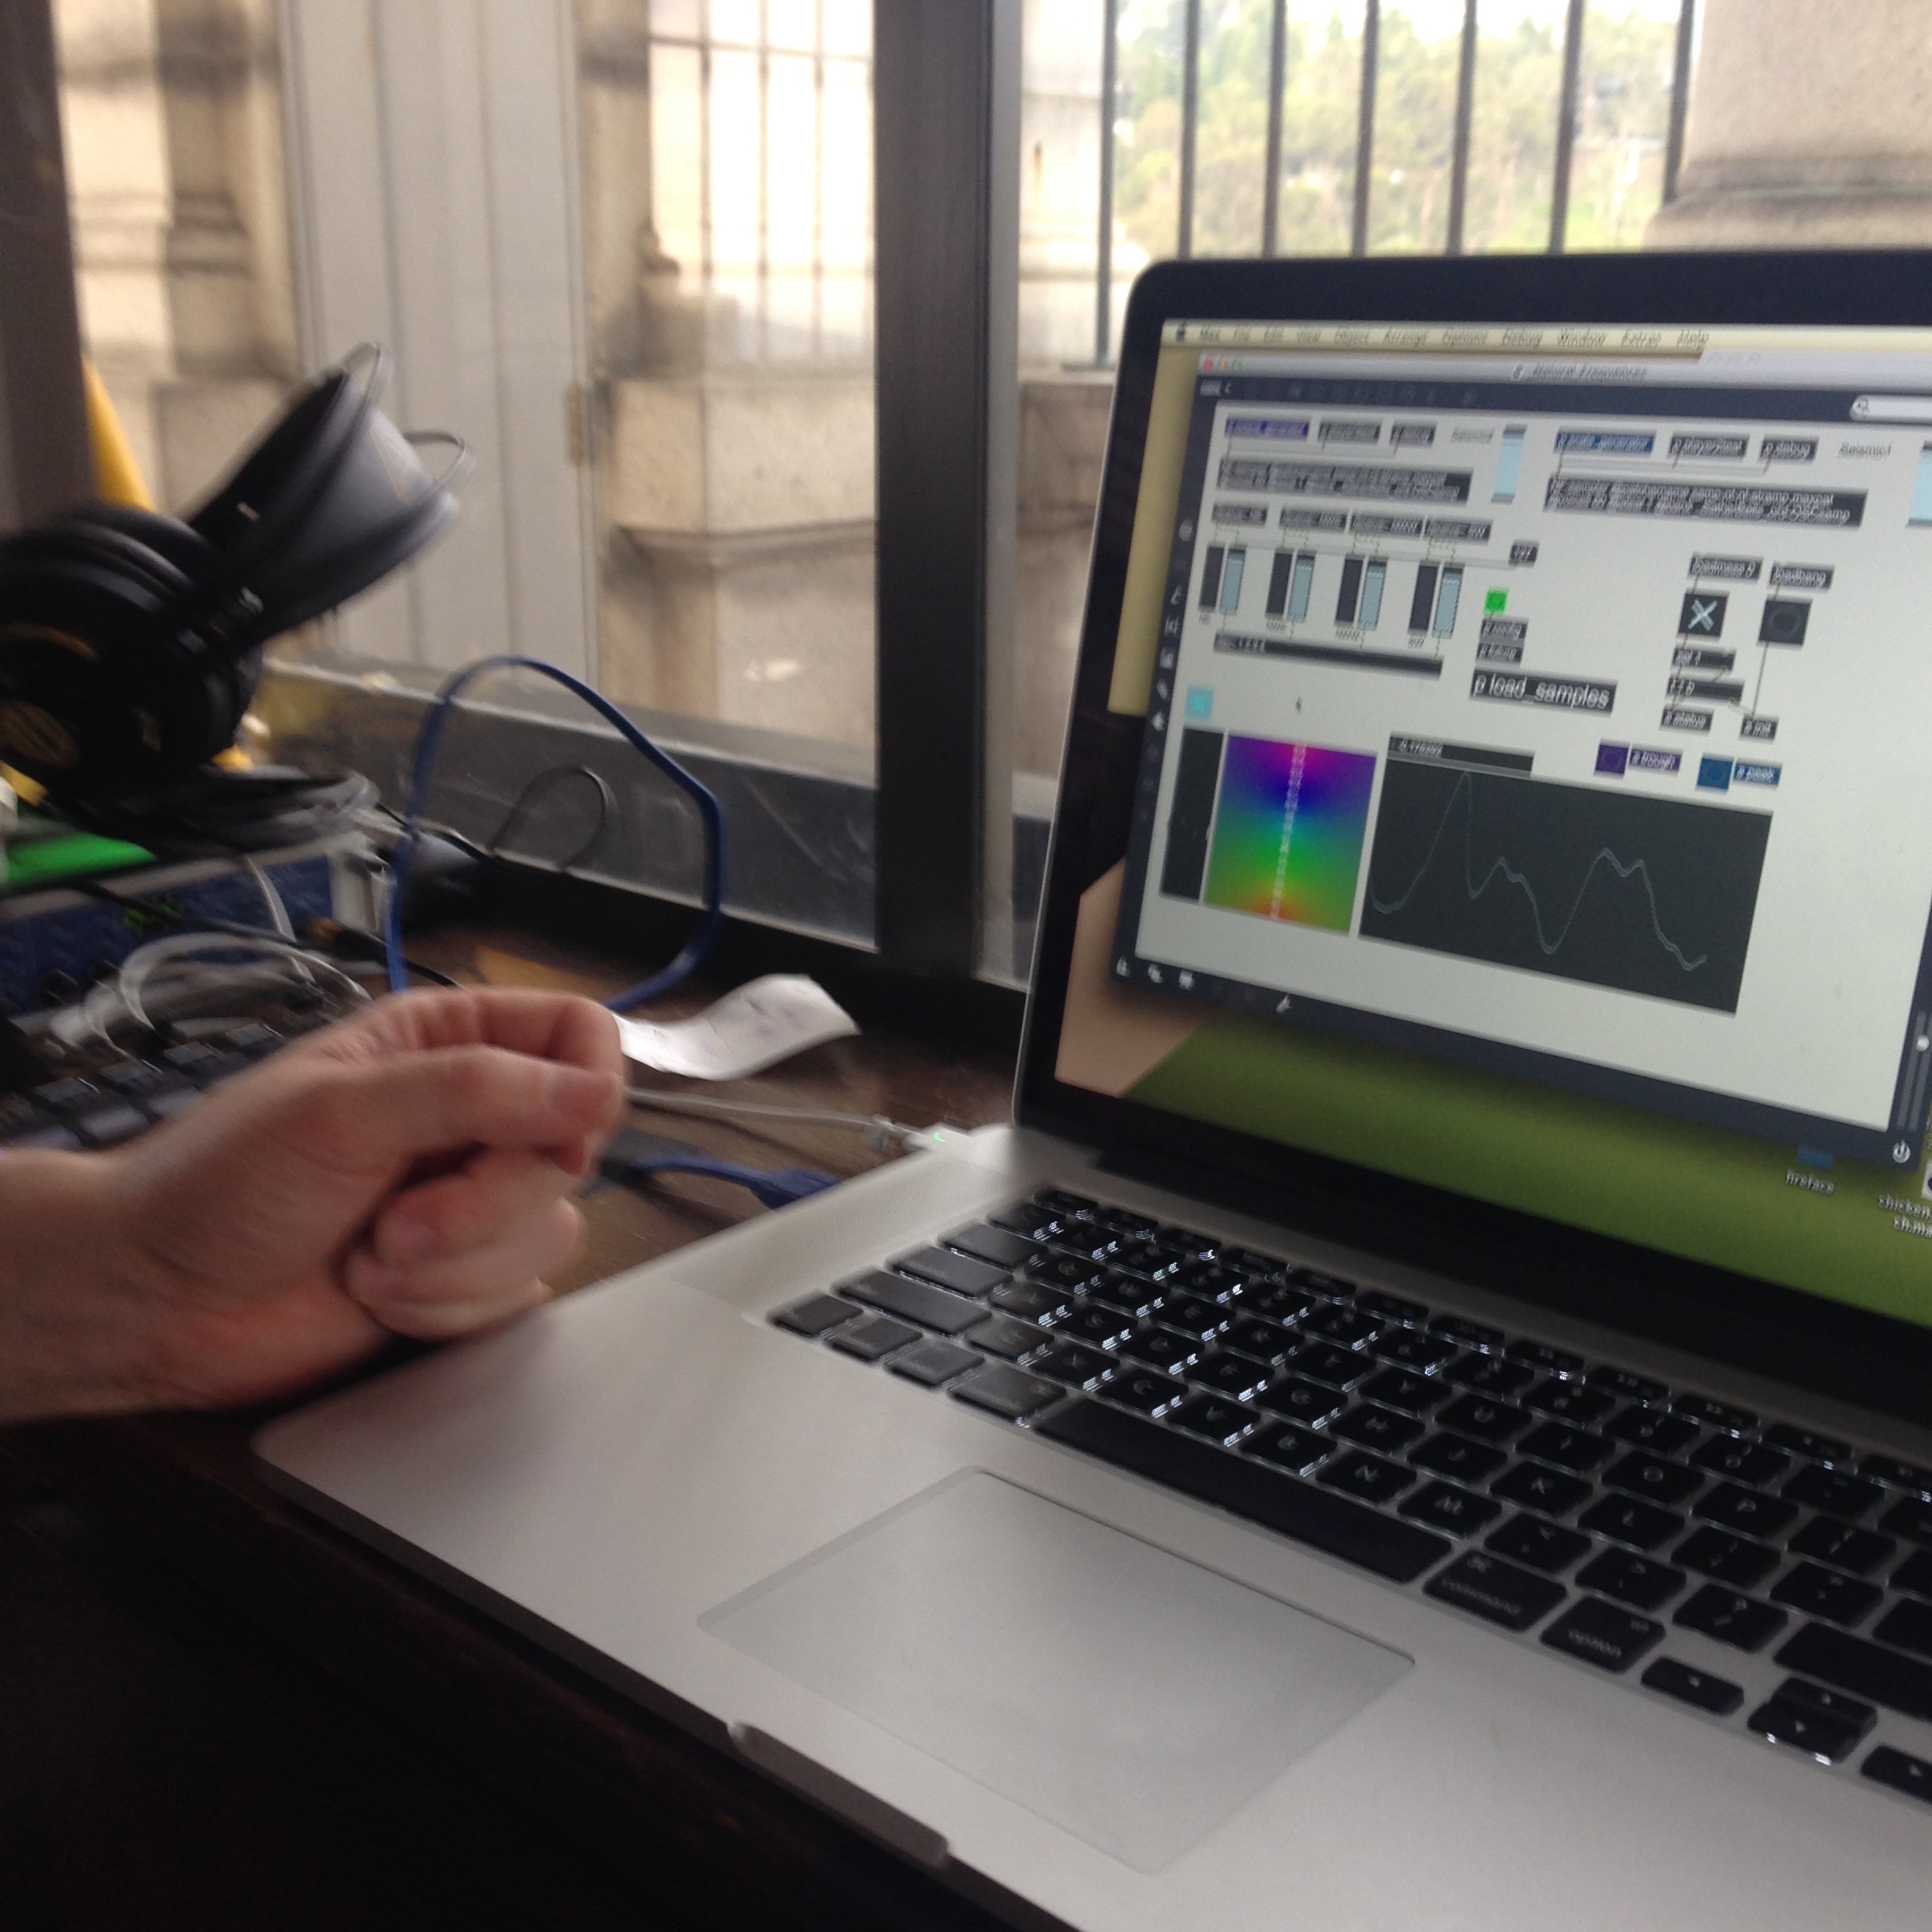
For “Natural Frequencies,” Campion, with Jeff Lubow at the Center for New Music and Audio Technologies, created a computer program that tells the bells what to play based on the earth’s movements. The program, says Campion, isn’t “reading a score. It’s generating a score.” Greg Neimeyer, who designed the project's lighting, has also experimented with the intersection of data and live events; his previous work includes a piece in the 2013 Venice Biennale that translated data from the rising tides threatening the Maldive Islands into a sound and visual composition. Campion also got help from Perin Meyer of Berkeley's Meyer Sound—the audio firm whose Constellation system, in place locally at Zellerbach Hall and SoundBox, examines audio data and accordingly makes acoustic adjustments. The seismic data at the core of “Natural Frequencies” is supplied by UC Berkeley’s Seismological Laboratory, which has sensors directly below Sather Tower. In many ways, “Natural Frequencies” taps into a current obsession of the digital age: data visualization. All around the world, as more data is collected by the internet, visualization tools bring it to life. Niemeyer points out that much of the world's data is used to look back on that which has already happened, but “Natural Frequencies” sees data in “real time,” and that can be exciting or frightening. “It’s a live stream," he says, "so we don’t know what is going to happen.”

